|
BAIHP
Research: A. Manufactured Housing Research Cont'd
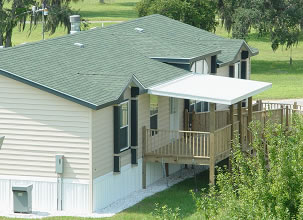
- Zero Energy Manufactured Home (ZEMH)
Nez Perce Fish Hatchery, Idaho
Category
A, 1 home
|
Figure
57 Zero Energy
Manufactured Home,
on site at the Nez Perce Fish Hatchery |
BPA,
working with BAIHP staff in Idaho and Washington, provided
funding for the most energy efficient manufactured home
in the country. The RFP was sent to 18 Northwest manufacturers;
Kit HomeBuilders West of Caldwell, Idaho was selected as
the manufacturer of the home. BAIHP staff solicited 24
industry partners to provide energy efficient building
components, including Icynene wall, floor and roof insulation,
a low-cost HUD-approved solar system, sun-tempered solar
design, and Energy Star© windows,
appliances and lighting. Partners include Building America
Team members such as Flexible Technologies, Icynene and
LaSalle. Complete list of specifications provided in Table
29.
The ZEMH (Figure 57) was built in the Fall
of 2002 along with a control home. The ZEMH was displayed
at the 2002 Spokane County Interstate Fair before siting
at the Nez Perce tribal fish facility near Lewiston Idaho.
Blower door and duct leakage tests at the plant and on-site
indicate that this is the tightest home ever tested by
BAIHP staff.
Working with FSEC and BPA, BAIHP staff installed monitoring
equipment for the ZEMH. Monitoring began in the 2003
and includes the following:
- Total electric use from grid
- Resistance elements in heat pump
- Heat pump compressor and fan motors
- Water heating equipment, including gallons used
- PV energy production (ZEMH)
Table 29 Zero Energy Manufactured
Home (ZEMH) and Base Case Home (Control) |
Component |
ZEMH |
Base |
Wall Structure |
2x6 ft, 16 in on center |
Same |
Wall Insulation |
R21 foam-spray |
R21 batt |
Floor Structure |
2x8 ft, 16 in on center |
Same |
Floor Insulation |
R33 (R22 Foam + R11 batt) |
R33 Blown Cellulose |
Vented crawl space wall |
R14 foil faced foam |
None |
Roof/Attic Structure and
Finish |
16 in on center
40 lb
roof load
4/12 pitch metal roofing
|
24 in on center
Standard
30 lb roof load
Same pitch and finish
|
Roof/Attic Insulation |
R49 foam |
R33 blown cellulose |
Window/Floor area ratio |
12% |
Same |
Windows |
Vinyl Frame, Argon filled,
low-e, Energy Star Approved |
Same |
Window Shading |
Dual blinds, heavy drapes,
awnings |
Single blinds, light drapes |
Doors |
U=0.2 metal, foam w/thermal
break |
Same |
Solar |
Solar ready design (mounts,
flashings and electrical chase)
4.2 kW peak rated PV
system with a 4 kW inverter and 12 kWh battery array
|
None |
HVAC |
2 ton unitary air-source
heat pump
12 seer, 7.8 HSPF
|
Same |
Zone heat |
150 W Radiant Panel in
kitchen |
None |
Ducts and cross over |
R8 crossover
Flex Flow
crossover system
Mastic with screws
More efficient duct design
|
R8 crossover
Sheet metal
elbows
Standard foil tape
|
Lighting |
100% Energy Star T8 and
CFL fixtures |
T12 and Incandescent fixtures |
Appliances |
Energy Star washer and
dryer, refrigerator, dishwasher |
Standard equipment |
Whole House Ventilation |
Heat Recovery Ventilator
w/HEPA, continuous operation (turned off in 8/04) |
Quiet (low-sone) Energy
Star exhaust fan, continuous operation |
Spot Ventilation |
Energy Star bath fans,
std. Kitchen fan |
Quiet (low-sone) bath
fans, std. Kitchen fan |
Ceiling Fans |
Energy Star with dimmable
CFL |
Standard with Incandescent
bulbs |
Domestic Hot Water |
PV controlled, active
anti-freeze solar water system, with 80 gallon storage,
and 64 ft 2 of collector area solar pre-heat tank (pre-plumbed),
40 gallon standard tank EF=0.93 |
EF=0.88 standard electric |
Air Sealing |
Wrap with tape flashing
Marriage line gasket (new product)
Penetrations sealed
with foam insulation
|
Wrap without tape flashing
Standard practice marriage line sealing
|
Air/Vapor Barrier |
Walls and Ceiling: Painted
Drywall
Floor: Floor decking
|
Same |
Data logger collects 15 minute data from wired sensors
and transmits daily to the host computer at FSEC via
modem. Summary data reports are available at www.baihp.org under “Current
Data.” Plug-type loggers were installed in mid
March 2003 to sub-meter the energy use of the refrigerator,
freezer and clothes washer in each home, as well as the
radiant heat panel and HRV in the ZEMH. Data from these
loggers was collected by occupant readings in mid-December
2003.
Preliminary findings
Measured
net energy use of the ZEMH 6% is lower than the base home,
not normalized for occupant behavior. This also does not
take into account the fact that the ZEMH’s PV system
was only fully operational for one month.
The ZEMH required 45% less space heating energy, possibly
due to improved building envelope measures, and the lack
of consistent HRV operation.
The measured envelope leakage in the ZEMH was 2.0 ACH50,
much lower than the base home (indeed, lower than any
other NEEM home tested in the field) and substantially
tighter than typical HUD code homes.
The ZEMH total duct leakage was 46% lower than the base
home; leakage to the outside was 405% lower than the
base home. The BAIHP staff speculates that the unprecedented
low leakage to the outside value is the result of the
ducts in the ZEMH being located within the conditioned
space, and effectively within the pressure envelope of
the home, surrounded as they are by foam insulation.
The solar water heating system in the ZEMH provides
most, if not all of the hot water needed during the summer
months, and roughly 45% of the total hot water demand.
The PV system with net metering provides 38% of the total
ZEMH energy use.
The
project highlights the importance of occupant choices and
behavior on the performance of energy efficient housing.
Based on the preliminary monitoring data and occupant surveys,
the behavior patterns of the ZEMH occupants are not themselves “energy efficient”.
These patterns create the appearance of a less efficient
home. On the other hand, the behavior of the ZEMH occupants
may shorten the payback for the innovative technologies
of the ZEMH.
BAIHP staff also performed a benchmarking analysis on
the ZEMH, as part of the overall benchmarking effort.
The ZEMH reached a level of 60% above the NREL prototype,
which indicates the difficulty of obtaining a high benchmarking
score.
In December of 2004, a research paper was presented
at BTECC which provided a preliminary evaluation of the
ZEMH performance without the full operation of the PV
net metering system. By the spring of 2006, there will
be a full year of ZEMH data, with the PV system operational.
- Manufactured
Housing Indoor Air Quality Study
Plant City, Florida, and FSEC MHLab
Papers: Hodgson, A.T., Apte, M.G., Shendell,
D.G., Beal, D. and McIlvaine, J.E.R. (2002a). Implementation
of VOC source reduction practices in a manufactured house
and in school classrooms. In Levin, H. (Ed.), Proceedings
of the 9th International Conference on Indoor Air Quality
and Climate. Indoor Air 2002, Santa Cruz, CA, Vol. 3.
pp. 576-581.
Hodgson, A.T., D. Beal and J.E.R. McIlvaine. 2002b.
Sources of formaldehyde, other aldehydes and terpenes
in a new manufactured house. Indoor Air12: 235-242.
Hodgson,
A.T., A.F. Rudd, D. Beal and S. Chandra. 2000. Volatile
organic compound concentrations and emission rates in
new manufactured and site-built houses. Indoor Air10:
178-192.
This is a summary of several indoor air quality (IAQ)
projects designed to improve the IAQ of manufactured
homes; specifically to find ways to reduce the formaldehyde
levels found in manufactured homes. This was a collaborative
effort of the Florida Solar Energy Center (FSEC), Lawrence
Berkeley National Laboratory (LBNL) and Palm Harbor Homes,
Inc. (PHH), a leading nationwide producer of multi-section,
high-end, manufactured houses with corporate offices
in Addison, TX.
In
1999 – 2000
a study was conducted to identify and verify the major
sources of formaldehyde, aldehydes, and terpene HCs in
a new manufactured house. Laboratory emission tests were
conducted with a number of wood and engineered wood products
and aldehyde and volatile organic chemical (VOC) measurements
were made in the house. Although only a single house was
studied, the information on sources is anticipated to have
broad application to residential construction due to the
widespread use of similar materials and building practices.
The manufactured house was typical of better quality
two-section houses produced in Florida. It was completed
in November 1999. Within three weeks of manufacture,
it was installed at a nearby site. The house was used
daily as a sales model. It was decorated, fully furnished,
but unoccupied. There were three bedrooms and two bathrooms.
The manufacturer supplied a detailed list of materials
used in the house. Between December 1999 and January
2000, ~30 specimens of the major materials were collected
from the production facility. These were cataloged, packaged
in aluminum foil, and shipped to the laboratory by airfreight.
The specimens were stored at room conditions in their
original packages until they were tested. Most materials
were tested within three months of collection. Measurements
were made after about a 3-week exposure, and area-specific
emission rates (i.e., emission factors) were calculated.
Air sampling in the house and outdoors was conducted
in March 2000. The house ventilation rate was quantified
concurrently by tracer gas decay. The ventilation rate
measurement and the VOC air sampling and analytical methods
for field and chamber work have been described previously
(Hodgson et al., 2000)
Whole-house emission rates for combined materials were
predicted based on the emission factors and the corresponding
material quantities. These predicted values were compared
to whole-house emission rates derived from measurements
of VOC concentrations and ventilation rates. For 10 of
the 14 target compounds, including formaldehyde, the
predicted and derived rates agreed within a factor of
two, which considering the uncertainties involved is
considered good agreement. The predominant sources of
formaldehyde in the house were bare particleboard (PB)
and medium density fiberboard (MDF) surfaces in the cabinetry
casework and molded high-density fiberboard doors. The
plywood subfloor under the carpet was a smaller source
of formaldehyde and the major source of higher molecular
weight aldehydes and terpene hydrocarbons.
As the result of this study, recommendations were developed
for reducing concentrations of formaldehyde and other
VOCs in new house construction (Hodgson et al., 2002a).
These are reproduced here in Table 30. The first
five recommendations are aimed at controlling or eliminating
important sources of formaldehyde. Other potential sources
of formaldehyde not addressed in the house study or in
the table include tack strips used for the installation
of wall-to-wall carpet and fiberglass insulation used
in wall, floor and ceiling cavities. Use of barrier materials
on the floor may result in moisture condensation problems
in hot-humid climates and possibly other situations and,
therefore, should be used with caution.
Table 30. Recommended
VOC Source Reduction Practices For New House Construction |
No. |
Source Reduction Practice |
1 |
When alternates exist, avoid wood products
with urea-formaldehyde resin system |
2 |
Construct cabinet cases with fully
encapsulated wood products |
3 |
Use frameless cabinets to eliminate
MDF stiles |
4 |
Apply laminate backing sheet to undersides
of PB countertops |
5 |
Use alternate low-formaldehyde emitting
passage doors |
6 |
Apply barrier material over plywood
subfloor in carpeted areas |
In
2004 a pilot demonstration project was conducted at PHH’s
production facility and sales office in Plant City, FL. The
project was originally conceived in 2002 as a side-by-side
demonstration of simultaneous improvements in energy performance
and IAQ to be achieved using existing technologies. The concept
was to build two houses, essentially identical with respect
to their size, floor plan, and major materials. One house
would have added features to improve energy performance and
IAQ. The other house would have no special modifications
and would serve as the control. They would be sited in a
residential community on adjacent, identical lots. Both would
have computer-simulated occupancy (i.e., controlled use of
lights, appliances, heating and cooling). Monitoring of energy
usage and performance and IAQ metrics would be conducted
over at least a one-year period. Finding the appropriate
residential site and the funds needed to cover the costs
associated with maintaining the houses at the site for a
year proved difficult. Consequently, the study plan was modified
in 2003 to reduce costs and take advantage of PHH’s
model home sales office in Plant City.
Approximately
on an annual cycle, PHH builds examples of their new houses
for display at their sales office. The houses present PHH’s
range of models and features. They are decorated and furnished,
but unoccupied. The houses are open to the public during
normal business hours seven days a week and their heating
and cooling systems are operated accordingly. The use of
these houses as study houses has some limitations. The
houses generally vary somewhat with respect to size and
floor plan, interior finishes and furnishings may vary, orientation
with respect to sun and wind may vary, monitoring instrumentation
must be kept out of sight, and sampling can only be conducted
outside of normal business hours. In addition, computer controlled
simulations of occupancy are not possible.
To the extent possible, the study plan was revised to accommodate
these factors.
In
June 2003, two model houses, then in the planning stage,
were selected for use in the project. A 1,440-ft2, double-wide
house designated as “Monte Carlo” was selected
to receive the energy and IAQ modifications. A 1,540-ft2
double-wide house designated as “Edison 2” was
selected to serve as the primary control house. The houses
were to be installed on nearby lots in the sales center in
approximately the same orientation.
The project participants early on developed specifications
for enhanced IAQ. These specifications were reviewed and
revised in June 2003 to reflect those energy and IAQ modifications
determined by PHH management to be relatively easily installed
on the production line and/or during installation. The revised
IAQ specifications are listed in Table 31.
Table
31 Revised IAQ Specifications |
Component |
Specification |
Cabinet Construction |
Use plywood face frame
material and vinyl-two-sides (V2S) particleboard for
all casework |
Countertops |
Construct all countertops
with V1S particleboard with vinyl surface on underside
of tops |
Carpeted Floors |
Install Tyvek (Dupont)
house wrap over plywood subfloor before installing
carpet. Use Nylon 6,6 carpet and synthetic fiber carpet
cushion (both CRI Green Label) |
Wall & Ceiling
Paint |
Use low VOC interior paints
(Sherwin-Williams Harmony brand) |
Passage Doors |
Use vinyl-coated doors |
Trim |
Use wood lumber trim throughout
house; avoid use of MDF trim |
Recessed Light Fixtures |
Install gasketed light
fixtures |
The two houses were produced in late July and early August
2003. Installation of the two houses was completed and the
heating and air conditioning (HAC) systems were operational
by the end of September. Not all of the originally planned
IAQ modifications (Table 2) were installed in the Study house.
Standard molded high-density fiberboard, passage doors were
used, as the door manufacturer no longer produces vinyl-coated
doors. Medium-density fiberboard (MDF) was used for the face
frames of the cabinets because PHH did not have sufficient
stock of the plywood material. Standard tack strips with
unquantified emissions of formaldehyde were used for the
carpet installation, as LBNL was unable to identify an alternate
with low formaldehyde emissions.
Energy Gauge ratings of the experimental house (Monte Carlo)
and the control (Edison) showed that the control house was
an Energy Star home, scoring 86.5, while the experimental
house was a Building America house, scoring 91.1. There were
many obstacles to successfully retrieving data from the houses,
but available results show that the BA house saved about
50% more air conditioning energy than the control house. Figure
58 illustrates this. The plot normalizes the data by
plotting the daily air conditioner energy use pre ft 2 of
conditioned space versus the average daily temperature difference
between the inside and the outside (Average Daily )T). 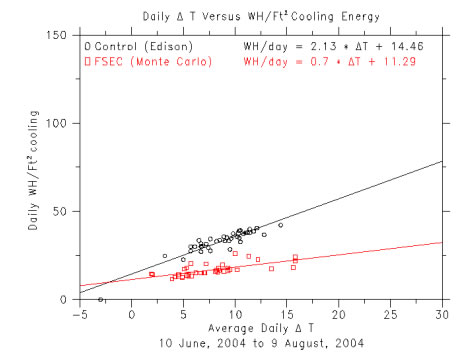
Figure 58
IAQ work started with an initial set of active air samples
for VOCs and aldehydes collected outdoors and in the Study
and Control houses on December 11, 2003, approximately
2.5 months after the houses were fully operational. The
second set of active samples was collected three months
later on March 2, 2004. Passive aldehyde samples were obtained
in the Study and Control houses and in an additional triple-wide
house of the same age over four one-week intervals between
these dates.
There were some distinct differences between the concentrations
measured in the two houses. Notably, the concentrations
of formaldehyde in the Study house were about three times
higher than concentrations in the Control house. This difference
was not anticipated based on the source reduction measures
aimed at lowering the emissions of formaldehyde in the
Study house.
Based on previous laboratory measurements of formaldehyde
emissions from interior components, we anticipated a minimum
25% reduction in the formaldehyde emission rate in the
Study house relative to the Control house. This was anticipated
due to the use of fully encapsulated particleboard for
the cabinetry casework, a diffusion barrier on the undersurface
of the particleboard countertops, and the weatherization
barrier applied over the plywood subfloor (Hodgson et al.,
2002b). We additionally expected the difference to persist
over the course of a year. The two-fold higher formaldehyde
emissions in the Study house prompted us to abandon our
original plan of quarterly measurements and instead to
focus on identifying the unexpected source of formaldehyde
emissions in this house. Firstly, FSEC and PHH staff jointly
inspected the houses. This inspection confirmed that the
intended formaldehyde source reduction measures had been
implemented in the Study house.
Two
other potentially relevant differences between the houses
were known at the time. Due to the energy efficiency
specifications for the Study house, a different manufacturer
than the HAC system in the Control house produced the
HAC mechanical system in the house. Secondly, some furniture
believed to be solid wood had been newly purchased for
decoration of the Study house. Older furniture taken
from PHH’s stock was used
to decorate the Control house.
In July 2004, the potential for the HAC systems to emit
formaldehyde was investigated. Each system is located in
a closet near the central living area. Active sampling
for formaldehyde was conducted in each house. The differences
between the return and supply measurements were small,
about plus 3% for the study house and about minus 8% for
the control house. These differences are within the uncertainties
of the measurements and, therefore, are not significant.
Another
inspection revealed that some of the backsides and undersurfaces
of the new wood furniture were fabricated from particleboard,
a typically high formaldehyde emission source (Kelly
et al., 1999; Hodgson et al., 2002b). Due to delays imposed
by PHH model center needs and 2004’s
hurricane season, in December 2004, approximately
14 months after the furniture was first delivered, we
located the furniture pieces in a storage garage. From
one accessible piece, we obtained 4.4-cm diameter specimens
of 3-mm thick particleboard using a hole-saw. Specimens
of 13-mm thick particleboard were similarly collected
from a furniture piece that was several years old and
was used in the sunroom of the house.
The emissions of formaldehyde from the two specimens of
furniture particleboard individually were measured in the
laboratory using small-scale environmental chambers as
described by Hodgson et al. (2002b).
From
the purchase requisition and the company’s
sales literature it was determined there were eight
new pieces of living room and master bedroom/retreat
furniture that likely contained some particleboard. The
total exposed surface area (one side) of particleboard
in these pieces was estimated to be 8.5 m2. Thus, the
estimated formaldehyde emission rate attributable to
the new furniture was about 80% of the total formaldehyde
emission rate derived for the house in December 2003.
Based on the formaldehyde emissions from the particleboard
from the older furniture, it is likely that the formaldehyde
emissions attributable to furniture would have been substantially
lower if older furniture pieces had been used.
This study did not progress as originally intended, and
the results did not conclusively show the efficacy of low-cost
measures intended to reduce the sources of formaldehyde
in the Study house. However, it is likely that the source
of the elevated formaldehyde emissions was correctly identified
to be a component of the new wood furniture installed in
this house and not in the Control house. If one-half the
estimated formaldehyde emission rate from the new furniture
(i.e., approximately the difference between the emissions
from new and old furniture particleboard) is subtracted
from the whole-house emission rate, the formaldehyde emission
rate in the Study house is nearly equivalent to the rate
in the Control house.
A formaldehyde concentration of 50 ppb and below has been
suggested as a reasonable target for new houses (Sherman
and Hodgson, 2004). The source reduction measures directed
toward other VOCs were successfully demonstrated. The use
of the weatherization barrier applied over the plywood
subfloor in the Study house appeared to function as predicted
to reduce the emissions of higher molecular weight aldehydes
and terpene hydrocarbons from this source, and the use
of the low VOC interior paint reduced the emissions of
a major VOC component associated with latex paints.
Data
collection was curtailed by the onset of 2004’s
hurricanes, three of which impacted Plant City, and
sales activity resulting in houses moving. The collected
data did show that the energy goals established for the
house were met, with a 50% reduction of energy use for
air conditioning compared to the control house.
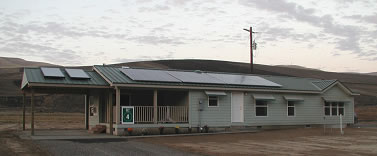
- Manufactured
Housing Laboratory - Ventilation Studies
FSEC, Manufactured Home Laboratory
Paper:
Moyer, Neil, Chasar, Dave, Hoak, Dave, Chandra, Subrato, "Assessing
Six Residential Ventilation Techniques in Hot and Humid Climates," Proceedings
of ACEEE 2004 Summer Study on Energy Efficiency in
Buildings, American Council for an Energy Efficient
Economy, Washington, DC, August 2004. (Also available
online at www.baihp.org under Current
Data and Publications)
Ventilation Study
|
| Figure 59 Manufactured Housing Laboratory
at FSEC (above and below) was site for study of
six residential ventilation systems. |
|
The MHLab (Figure 59) is
a research and training facility of 1600 ft 2. This Energy
Star® manufactured
home has two separate heating and cooling systems:
- An overhead duct system connected to a package unit
air conditioner with electric resistance heating.
- A floor-mounted duct system connected to a split
system air conditioner, also with electric resistance
heating.
Only the floor mounted duct system was used in these
ventilation experiments.
Introduction
Ventilation is a HUD code requirement. The goal of ventilation
is to add fresh air to the home. This may be accomplished
by supplying outside air to the house or mechanical system,
exhausting air from the house (which consequently pulls
air into the house through joints in the walls, floor,
and ceiling), or a combination of the two.
Supply based ventilation tends to slightly pressurize
the home whereas exhaust based ventilation does the opposite
slightly depressurizing the house. The disadvantage of
supply based ventilation is that it forces conditioned
air into the floor, wall, and ceiling cavities, possibly
leading to condensation or mold growth in cold climates
and during the heating season. Likewise the disadvantage
of exhaust systems is that they pull unconditioned outside
through the floor, wall, and ceiling cavities into the
conditioned space, possibly leading to condensation,
mold growth, or uncomfortably high indoor humidity levels
in hot and hot-humid climates and during the cooling
season. The six residential ventilation strategies evaluated
are described in Table 32.
Table
32 Ventilation Strategies Studied in the MHLab |
Case
(Name)
|
Strategy |
Description |
# 1
(None). |
No mechanical ventilation |
Base Case scenario included only
the heating and cooling system of the home with no
outside air (OA) ventilation. |
# 2
(Spot) |
Spot ventilation (exhaust only) |
Bathroom and kitchen exhaust fans.
Operation scheduled for 30 minutes after a simulated
moisture producing event such as a shower or oven
use. |
# 3
(OA)
|
Outside air (supply based) |
Dedicated, filtered outside air duct
to return plenum when the heating or cooling system
is operating. Quantity of ventilation air provided
depends on air handler run-time. |
# 4 (Dehumid) |
Outside Air plus 10/20 Cycle and
Dehumidification (Supply Based) |
Same
as #3, except with an added air handler fan controller
(10-minute “on” -
20-minute “off” minimum duty cycle).
Provides scheduled ventilation when no cooling or
heating is called for. A stand alone room dehumidifier
(set to approximately 50% RH) located in vicinity
of the return air grill. |
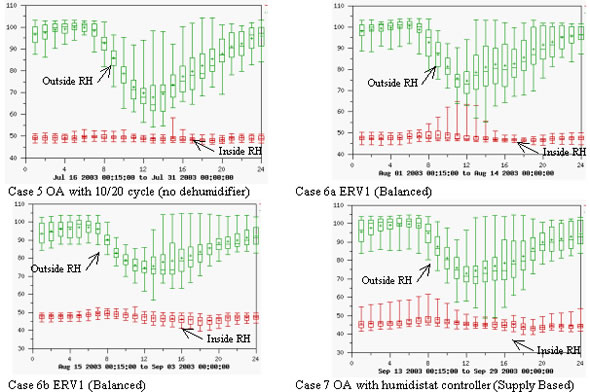
# 5
(10/20 Cycle)
|
Outside Air plus 10/20 cycle (Supply
Based) |
Same as #4, except without the room
dehumidifier. |
# 6 (ERV1) (ERV2) |
Energy recovery ventilator (ERV1,
ERV2) |
Two different enthalpy transfer media
were used. Outside air was drawn in through the ERV
at a rate to meet the ventilation requirements. |
# 7
(Hstat)
|
Outside Air plus Humidistat (Supply
Based) |
This is a modified air handler fan
speed control. When dehumidification is needed, the
air handler fan is operated at lowest speed for enhanced
latent control. A higher speed is selected when sensible
cooling is needed. Ventilation air supplied via an
outside air duct, with air handler fan operation
controlled as in #4. |
House Operation and Experimental Procedure
Occupancy Simulation: Automated, computer controlled
devices, such as appliances, showers, and lighting, simulate
the sensible/latent heat generation and carbon dioxide
(CO 2) production of a family of four persons with periodic
showers, cooking and cleaning.
The
simulated latent occupancy load from breathing, bathing,
cooking, and laundry was achieved by adding 14 to 15
pounds of water per day based on documentation of "average" household
operation based on ORNL research conducted by Jeff Christian.
Water vapor was injected into the space using a vaporizer
at a rate of approximately 0.4 lbs per hour continuous
and an additional 0.4 lbs per hour during the evening
hours.
Ventilation Rate: Researchers conducted whole
house air tightness tests using sulfur hexafluoride as
a tracer gas for a decay analysis (Figure 60)
to determine if each ventilation strategy met the ASHRAE
62-2 Ventilation Standard during the test period. The spot
ventilation strategy (#2) did not meet the standard on
a daily basis as the runtime was not long enough. The outside
air method (#3) was marginal in meeting the standard. Strategies
#4-#7 met the standard.
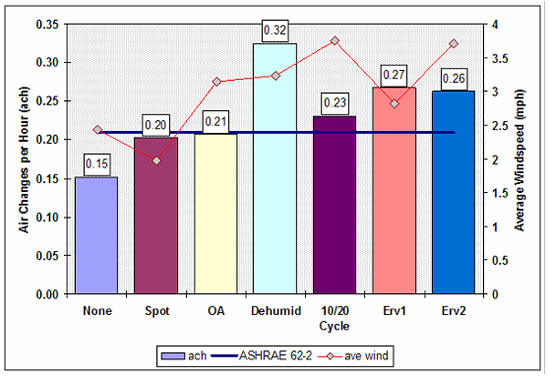
Figure 60 Results of tracer gas decay
testing indicating operational infiltration
(house not
under test pressure) rates measured for each ventilation
strategy.
ASHRAE Standard 62.2 was the target ventilation
rate, not met by Spot or OA
strategies. Note:
Wind speed averaged over 2 hour infiltration test.
Whole House and Duct Air Tightness: The average
whole house air leakage (CFM50) was 1224 (ACH50 of 5.4).
The target normalized duct leakage is Qn #6%, where Qn=CFM25/conditioned
area, this is the same as the duct leakage target in
the Manufactured Home Energy Star program. The total
duct system leakage in the MHLab Qn total=5% (CFM25 total
= 75) with leakage to the outside measured to be Qn (out)=3%
(CFM25 out = 45), well under the leakage target.
Interior temperature and relative humidity: A
digital thermostat maintained interior temperature at 75
degrees Fahrenheit. Interior temperature and relative humidity
sensors are located on the same wall as the thermostat,
at approximately the same height from the floor. Dedicated
interior relative humidity control was only available with
the dehumidifier strategy, and was a byproduct of cooling
coil operation in the other strategies.
Cooling/ventilation power usage
With all mechanical ventilation systems, additional energy
use from both increased conditioning loads and fan (if
present) power is expected. The split system with the floor
duct system is a 12 SEER system with a rated cooling capacity
of 30.2 kBtu. The ventilation strategies that required
the use of the air handler fan, an energy recovery ventilator,
or the dehumidifier had the energy use added to the cooling
energy. The dehumidifier strategy did use the most energy
for cooling; however, it should be noted that this test
occurred during the hottest ambient conditions.
Findings
The
cooling energy required to maintain the 75°F interior
set-point appeared to vary as a result of the temperature
difference across the envelope (Table 33). A linear
regression analysis was performed to compare energy use
of the ventilation strategies as a function of temperature
difference across the envelope (Table 34). The
power use at the average temperature difference of five
degrees Fahrenheit is shown in bold.
Table
33 Average Ambient and Building Conditions |
| . |
Case 1 None |
Case 2 Spot |
Case 3 OA |
Case 4 Dehumid |
Case 5 10/20 |
Case 6 ERV1 |
Case 6 ERV2 |
Case 7
Hstat |
Indoor
Temp (°F) |
74.5° |
74.5° |
74.7° |
74.9 ° |
74.0° |
74.1° |
74.4° |
74.8° |
Indoor
Temp Max (°F) |
75.0° |
75.2° |
75.5° |
76.0 ° |
75.0° |
74.9° |
75.4° |
76.0° |
Indoor RH (%) |
49.2% |
45.7% |
49.5% |
47.9% |
49.1% |
47.8% |
47.2% |
45.7% |
Indoor
Dewpoint (°F) |
52.4° |
54.2 |
54.5 |
53.9 |
53.7 |
53.1 |
53.0 |
52.4 |
Outside
Temp (°F) |
78.6° |
78.6° |
78.4° |
82.1 ° |
79.8° |
79.3° |
80.8° |
79.2° |
Outside RH (%) |
89.2% |
79.5% |
87.7% |
83.4% |
87.0% |
90.0% |
86.9% |
88.1% |
Δ Temp (°F) |
4.3° |
4.0° |
3.7° |
7.1 ° |
5.8° |
5.1° |
6.5 |
4.4 |
Δ Dewpoint
(°F) |
18.6° |
20.7° |
19.5° |
22.4 ° |
21.4° |
22.7° |
23.3° |
22.6° |
Solar Rad. (kWh/m
2) |
53.5 |
107.3 |
68.9 |
76.3 |
86.8 |
66.3 |
101.9° |
77.1° |
Rainfall (Inches) |
3.6 |
0.5 |
4.7 |
0.1 |
4.0 |
5.1 |
3.2 |
4.9 |
Condensate (lbs) |
617 |
905 |
920 |
1131 |
1118 |
1034 |
1685 |
1282 |
Δ P
WRT Out (Pa) |
-0.2 |
0 |
0.1 |
0.4 |
0 |
-0.2 |
-0.2 |
0.1 |
Minimum RH |
42.1% |
38.8% |
45.8% |
46.2 % |
46.3% |
44.2% |
39.3% |
39.7% |
Maximum RH |
53.3% |
55.2% |
53.2% |
51.0 % |
58.4% |
64.8% |
53.0% |
61.4% |
Mean RH |
46.1% |
49.2% |
49.5% |
47.9 % |
49.0% |
47.8% |
47.2% |
45.7% |
RH Standard Deviation |
1.272 |
1.471 |
1.673 |
0.845 |
1.231 |
2.194 |
2.108 |
3.07 |
RH Range |
11.2 % |
16.3 % |
7.4 % |
4.8 % |
12.1 % |
20.6 % |
13.7 % |
21.7 % |
- Case 4, the dehumidifier system, has the highest average
power at 1592 watts.
- Case 7 (humidistat controlled fan speed or Hstat) is
second highest at 1485 watts.
- Case 5 (10/20 cycle controller) used the least power
at 1315 watts.
As might be expected, interior relative humidity had the
least variance with the dehumidification system with a
low of 46% and a high of 51% (Table 33 and Figure 61).
The best performing system, Case 4 (10/20 cycle plus dehumidifier),
was able to maintain the relative humidity at a nearly
constant level for almost 80% of the test period. The next
best performer was Case 2 (spot ventilation). Humidity
levels during the test period are graphed in Figure
61.
Table
34 Cooling and ventilation power (watts) usage as
a function of temperature difference across the building
envelope |
ΔTemp
(°F) |
Case
1 None |
Case
2 Spot |
Case
3 OA
|
Case
4 Dehumid |
Case
5 10/20 |
Case
6 |
Case
7 Hstat |
ERV1 |
ERV2 |
-5 |
487 |
499 |
475 |
499 |
411 |
459 |
367 |
526 |
0 |
924 |
911 |
949 |
1046 |
863 |
915 |
880 |
1006 |
5 |
1361 |
1324 |
1424 |
1592 |
1315 |
1370 |
1393 |
1485 |
15 |
2236 |
2150 |
2372 |
2685 |
2219 |
2280 |
2418 |
2443 |
Figure
61 Average hourly relative humidity
profiles for each strategy 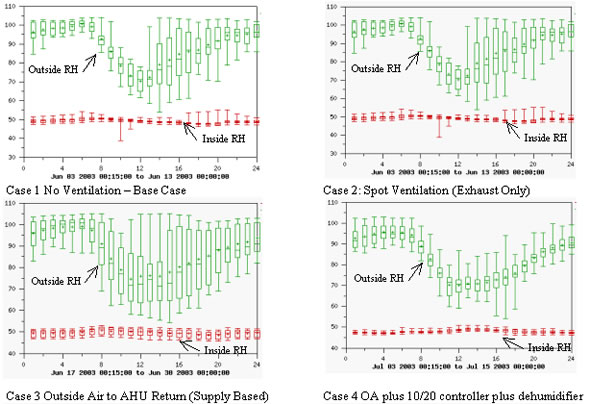
Conclusions
The operation of a correctly sized air conditioning system
with a supplemental dehumidification system to pre-condition
the outside air and provide additional dehumidification
of the space appears to provide the best interior humidity
control (Table 33, in bold) with only a slight
increase in energy usage – about 200 watts (Table
34). This is represented by Case 4 of this study.
Only this strategy was able to maintain the interior humidity
conditions in a range of less than 5% (Table 34,
in italics).
Though
all of the strategies did provide some humidity control
over the test period, it is most likely a result of the
run time afforded by the correctly sized air conditioning
system and the consistent simulated interior sensible load.
When an air conditioning system operates for extended periods
of time, the removal of moisture from the air stream is
enhanced (Khattar, Swami & Ramanan 1987).
Additional testing with other ventilation strategies in
the MHLab will be undertaken in the next budget period.
- Manufactured
Housing Energy Use Study, North Carolina A&T
Paper: W. Mark McGinley, Alaina Jones, Carolyn
Turner, Subrato Chandra, David Beal, Danny Parker,
Neil Moyer, and Janet McIlvaine. Optimizing Manufactured
Housing Energy Use. Symposium on Improving Building
Systems in Hot and Humid Climates, Richardson, Texas,
May 17-19, 2004.
Side-by-side
monitoring of two manufactured homes at North Carolina
Agricultural and Technical State University (NCA&TSU),
evaluated the value of a variety of energy saving technologies
and techniques. (Figure
62 and Table 35) Home instrumentation measured
energy consumption as well as interior and exterior
climatic conditions. The “standard home,” designed
and built to basic HUD code requirements, represented
the control home. Modified to use at least 50% less
energy, the “energy home” met Building
America standards. Cooperating researchers at NCA&TSU
and FSEC investigated energy feature performance and
compared actual energy used to energy modeling program
predictions. In-situ energy performance data provided
researchers with interesting information on both issues.
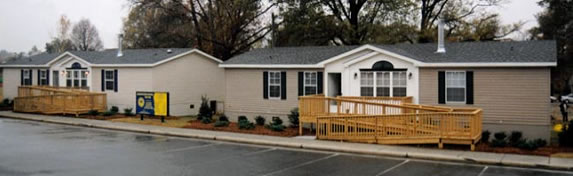
Figure 62 Side-by-side
monitoring of manufactured homes at NCA&TSU.
Each
model contained 1,528 ft 2 of living area with nearly
identical floor plans. Though the homes were unoccupied
during the testing, home lighting and water heating use
was simulated with timers. A datalogger in each home
recorded: (1) the interior and exterior temperature and
humidity along with solar radiation and wind speed, (2)
the home’s total power
consumption, (3) the air conditioning/heat pump compressor,
air handler fan, and electric resistance heater use
(primary heater in the standard house, backup or
emergency heater for the energy house), and (4) water
heating and water usage data.
The energy house features combined higher insulation
values, improved windows, centralized and airtight
duct design, high efficiency heat pump, and a solar
water heater. Feature-by-feature construction differences
are highlighted in Table 35.
Table
35 Specifications of Standard and Energy Construction |
Characteristic |
Standard House |
Building America
House |
square footage |
1528 |
1528 |
floor insulation |
R-11 |
R-22 |
wall insulation |
R-11 |
R-13 |
ceiling insulation |
R-20 |
R-33 + roof deck
radiant barrier |
windows |
single pane with interior
storm |
low-E double pane |
exterior doors |
storm door on front |
storm door on all |
marriage wall seal |
fiberglass pad |
SOF-SEAL® gasket |
heating system |
resistance electric |
heat pump HSPF 7.5 |
cooling system |
central air conditioning
SEER10 |
central heat pump
SEER12 |
system size |
3 tons |
2 tons |
water heating |
electric
water heater – 40
gallon |
solar
water heater – 66
gallon |
duct joints |
industry standard |
sealed with mastic |
duct leakage |
*CFM5out = 145 |
CFM25out = 83 |
house leakage |
**ACH50 = 10 |
ACH50 = 9 |
*Cubic
feet per minute **Air changes per hour |
Data collection on the two
homes began in early January 2001 and continued through
this reporting period. Palm Harbor Homes in Siler City
manufactured both homes, the results for program year three
and four are detailed below.
Year 4 Side-by-Side Monitoring Results
During
Phase 2, modifications were made to the solar water heating
system in the energy efficient housing unit to help improve
the performance this system. Further, a number of the
incandescent light bulbs in the energy unit were replaced
with compact fluorescent bulbs. These changes were staged
to allow an evaluation of the effect of each measure
on the home’s energy use.
Based on investigative results, it can be concluded that:
- Changes
in the building envelope, HVAC and duct systems, and
fenestrations in the energy home met researchers’ 50%
energy use reduction goal. Measured annual energy savings
for heating and cooling energy was 58%, and 53% for heating,
cooling, and hot water production.
- Care
should be exercised in the manufactured housing unit
setup or relatively minor construction deficiencies
can significantly reduce a home’s energy efficiency.
Many of these items are invisible to the homeowner; therefore
procedures must be developed to ensure that deficiencies
do not occur during setup.
- The Energy Gauge energy analysis program appears to
give a reasonably accurate prediction for expected energy
use reduction in a typical manufactured housing configuration.
The predicted energy savings for the housing units evaluated
in this investigation ranged from 54% to 63%, while the
measured values ranged from 53% to 58%. Version 2.0 of
the Energy Gauge Program provided a more accurate energy
savings prediction than the older software versions.
- An increase in pipe and tank insulation can increase
not only the energy efficiency of a solar water heater
by reducing stand-by losses, but also can reduce the
cooling load in a manufactured housing unit and increase
the overall energy efficiency of the water heating unit.
Even small amounts of exposed piping can significantly
affect the energy efficiency of the water heating system.
- While providing essentially the same lighting levels,
replacing incandescent lamps with compact fluorescent
bulbs not only reduces lighting energy use, but also
reduces the home cooling load.
The total measured energy used by each of the housing
units for cooling and heating are shown in tables below. Table
36 shows the energy used for heating and cooling the
standard housing unit from January through August of 2002.
The standard home datalogger was struck by lighting in
mid-August 2002. Data after this point was not included
since only partial data is available and performance comparisons
were not possible. Table 37 shows a summary of
the cooling and heating energy used by the energy housing
unit. Tables 38 and 39 list the energy use for
hot water production for the standard and energy units,
respectively.
Table
36 Cooling and Heating Energy Use, Standard House Actual
Values (kWh ) |
| . |
SEP |
OCT |
NOV |
DEC |
JAN |
FEB |
MAR |
APR |
MAY |
JUN |
JUL |
AUG |
Phase
1 |
492.4 |
447.6 |
648.6 |
1741.1 |
2495.3 |
849.6 |
628.8 |
384 |
566.3 |
990.8 |
852.9 |
1066 |
Phase
2 |
. |
. |
. |
. |
2120.2 |
1717.1 |
1227.6 |
502.0 |
438.0 |
939.4 |
1079.4 |
511.2 |
|
Table
37 Cooling and Heating Energy Use, Energy Star
House |
. |
SEP |
OCT |
NOV |
DEC |
JAN |
FEB |
MAR |
APR |
MAY |
JUN |
JUL |
AUG |
Phase
1 |
337.3 |
205.7 |
150.8 |
452.8 |
1087.3 |
472.8 |
426.9 |
184.8 |
528.3 |
891.5 |
850.9 |
671.6 |
Phase
2 |
. |
. |
. |
. |
680.7 |
537.1 |
378.1 |
241.9 |
311.8 |
603.0 |
668 |
626.6 |
|
Table
38 Domestic Hot Water Use, Standard House |
. |
SEP |
OCT |
NOV |
DEC |
JAN |
FEB |
MAR |
APR |
MAY |
JUN |
JUL |
AUG |
Phase
1 |
197.8 |
267.7 |
250.2 |
212.6 |
0 |
0 |
217.6 |
244.9 |
258.1 |
227.5 |
207.9 |
213.5 |
Phase
2 |
. |
. |
. |
. |
294.6 |
280.9 |
283.2 |
264.9 |
280.2 |
192.2 |
200.3 |
85.2 |
|
Table
39 Domestic Hot Water Use, Energy Star House |
. |
SEP |
OCT |
NOV |
DEC |
JAN |
FEB |
MAR |
APR |
MAY |
JUN |
JUL |
AUG |
Phase
1 |
133.4 |
176.2 |
204.2 |
189.9 |
0 |
0 |
245.5 |
184.4 |
183.0 |
141.2 |
152.3 |
126.6 |
Phase
2 |
. |
. |
. |
. |
251.1 |
212.0 |
202.8 |
145.9 |
157.3 |
74.8 |
80.3 |
83.0 |
Also listed in each table are the monthly energy use
values measured during the first phase of this investigation,
January through August 2001. Please note that the energy
housing unit data prior to August 2001 is suspect due to
duct and HVAC system problems later corrected. The entire
data set, including, temperature, relative humidity, solar
radiation, and power use is listed on the FSEC web site
www.infomonitors.com .
The total energy used for water heating and central cooling
over the period of August 1 through August 15 was 363.5
kWh for the energy home and 596 kWh for the standard home.
This represents a 40 % reduction in energy use between
the two homes.
The total energy used over the period of August 1 through
August 15 for water heating was 27.13 kWh for the energy
house and 85.18 kWh for the standard home. This represents
a 68% reduction in energy use with the solar water heating
system and compares well with the June and July reductions
of 63% and 60%, respectively. Consistent findings indicate
that the tank and piping insulation has reduced the standby
tank losses and improved the solar water system efficiency.
In the energy housing unit, three of the 100 watt incandescent
lamps that were on the evening four-hour timed duration
were exchanged for 25 watt compact fluorescent lamps on
June 4th. This change did appear to have a small effect
on the cooling load in the energy housing unit. The relative
cooling energy used by each of the housing units from June,
2002 through August 2002 showed a small change. The percentage
reduction in cooling energy used by the energy housing
unit increased from about 30% to 38%. However, it is difficult
to isolate the effects of the improvements in the solar
water heating system insulation and the effects of the
compact fluorescent bulbs. In any event, these effects
appear to be much smaller than that produced by the hot
water system changes.
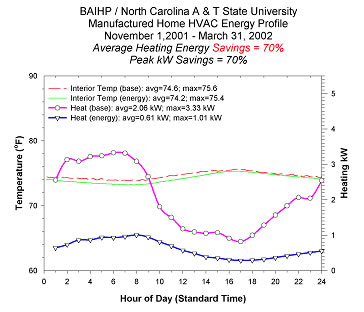
Year 3 Side-by-Side Monitoring Results :
|
Figure
63 Heating
season consumption and savings for side by side study
of Energy Star Manufactured Housing. |
Heating
system savings (2001 to 2002) were a remarkable 70% during
Phase 1. Cooling energy season savings were 36%, less than
heating but still very substantial. The combined heating,
cooling, and water heating savings were 52% for a 9-month
period. (Figure 63)
In
addition to the energy monitoring effort, NCA&TSU
researchers investigated the feasibility of replacing the
conventional framing/envelope used in manufactured/industrial
housing with alternative systems. Included in this evaluation,
was an analysis of the energy impact of using aerated autoclaved
concrete (AAC) flooring systems and structural insulated
panels (SIP) to supplant traditional wall and roofing systems.
The economic viability of using AAC blocks for structural
skirting/foundation around the model units also was evaluated.
Analysis’ results
determined:
- The best manufactured home energy performance can
be achieved using the SIP wall and roof systems with
the AAC plank. This performance can be further enhanced
with an R-8 unvented crawl space. Though a manufactured
home performs best with these alternative systems, the
cost to include them may not make economic sense.
- AAC planks can be designed to replace both the steel
frame and flooring systems for HUD code manufactured
housing units and modular units. These planks also can
be modified to incorporate built-in insulated ducts.
- AAC planks are pre-manufactured and require less assembly
labor than a typical stick framed unit, but including
the plank flooring would increase framing costs by 28%.
The heavier weight of an AAC system might exacerbate
high framing costs. Similarly, comparative analysis results
found that replacing a conventional framing system with
a SIP system would increase framing costs by 66%.
- At the current prices for energy and wood products,
neither the AAC plank system nor the SIP systems are
as economically effective as improvements in the current
conventional HVAC systems, steel and wood framing, sheathing
systems, and air barriers with respect to improving energy
performance.
- The use of AAC planks has the potential to be economically
viable in the modular housing market, especially if used
with sealed crawl space foundation systems, where their
improved resistance to moisture degradation would be
very important.
- SIP wall and roof systems also could prove to be economically
viable if the price of wood energy increases, and the
SIP manufacturing costs decrease through large volume
purchases.
- The
proposed AAC planking system presents a system that
is significantly less affected by water and moisture
degradation and may be effective in reducing manufactured
housing units’ susceptibility to flood damage.
These systems also are not susceptible to termite attack.
- The
savings from reduced transportation damage from greater
durability and increased floor system stiffness were
not addressed in this investigation. It wouldn’t
take many days of damage repair (at about $300/person-day
for personnel costs related to transportation) to vastly
improve the economics of these alternative systems.
|


