| |
|
| |
| Reference
Publication:
Chandra, Subrato, Neil Moyer, Danny Parker, David Beal,
David Chasar, Eric Martin, Janet McIlvaine, Ross McCluney,
Andrew Gordon, Mike Lubliner, Mike McSorley, Ken Fonorow,
Mike Mullens, Mark McGinley, Stephanie Hutchinson, David
Hoak, Stephen Barkaszi, Carlos Colon, John Sherwin, and
Rob Vieira. Building America Industrialized Housing
Partnership, Annual Report - Fifth Budget Period. 4/1/03
- 3/31/04. |
|
|
| Building
America Industrialized Housing Partnership, Annual
Report - Fifth Budget Period |
|
|
Subrato
Chandra, Neil
Moyer, Danny
Parker, David
Beal, David
Chasar, Eric
Martin,
Janet
McIlvaine, Ross
McCluney, Andrew
Gordon, Mike
Lubliner, Mike McSorley,
Ken
Fonorow, Mike
Mullens, Mark
McGinley, Stephanie
Hutchinson, David
Hoak,
Stephen
Barkaszi, Carlos
Colon, John
Sherwin,
and Rob Vieira |
|
| Florida
Solar Energy Center |
|
| |
|
- Eastern
Dakota Housing Alliance (EDHA), Applegren Construction
|
Figure
62
Selkirk Twin Homes, Grand Forks, ND. |
Eight
dwellings have been built by EDHA on Selkirk Circle in Grand
Forks, North Dakota (Figure 62) with the goal of
achieving up to 50% energy savings over the 1993 Model Energy
Code.
The two story dwellings include an insulated basement with
air circulation to the main house, suitable for conversion
to living space. Features of the Phase I and Phase II homes
are summarized in Table 34.
Phase I (March 2003) and Phase II (Feb 2004) included two
twin homes (duplexes) each. These and a theoretical base
case house using local conventional construction and code
minimums were modeled in DOE2 to determine energy savings
and cost effectiveness.
Estimated combined gas and electric utility savings ranged
from 25% on Phase I homes to 35% on Phase II homes over the
base case. The homes also met the BA goal of 40% savings
compared to the Benchmark house.
Table
34 Applegren Twin Home Specifications |
Component |
Base Case |
Phase I
(March
2003) |
Phase II
(Feb
2004) |
Conditioned Area Of Each Dwelling |
1840 ft2 (w/basement) |
Same |
Same |
Hers Score |
85.2 |
89.7 |
92.2 |
Envelope |
Above-Grade Wall Structure |
2x6 wood frame |
Same |
2x4 wood frame |
Above-Grade Wall Insulation |
R-19 fiberglass batt |
Same |
R-15 blown fiberglass |
Above-Grade Wall Sheathing |
Plywood |
Same |
R10 XPS Foam
Corners: R7.5+Plywood
|
Basement Walls |
R-11 |
Same |
Same |
Vented Attic |
R-49 |
Same |
Same |
Windows |
Double pane, low-e,
Argon-filled,
Vinyl slider frame
U=0.34, SHGC=0.33
|
Casement (instead of slider)
|
Same as phase I |
Infiltration (ACH50) (Including Basement) |
5 (assumed) |
2.8 (average of 4 units) |
2.4 (average of 4 units) |
Equipment |
Gas Furnace |
60kbtu, AFUE=78 |
60kbtu, AFUE=92 w/sealed combustion |
60kbtu, AFUE=92 |
Air Conditioner |
1.5 ton, 10 SEER |
Same |
Same |
Thermostat |
Standard |
Programmable |
Same as Phase I |
Ventilation |
None |
70% efficient HRV |
Same as Phase I |
Water Heater |
40gallon, EF=0.88 Electric |
40gallon, EF=0.62 Natural gas with
power vent |
Tankless, EF=0.83 Natural gas |
Lighting |
10% fluorescent |
85% fluorescent (linear and cfl)
Note:
only bathroom and dimmable fixtures were incandescent
|
Same as phase I |
Appliances |
Standard |
Energy
Star Dishwasher Horizontal-axis washer Energy Star
Refrigerator
|
Same as Phase I |
Moisture Issues
The low water vapor permeance of rigid XPS foam sheathing
(1.1 perms) presents a dilemma in this climate where an interior
vapor barrier (usually 6-mil polyethylene) is considered
mandatory to minimize moisture diffusion from the conditioned
space into the wall cavity. The installation of two vapor
barriers leaves the wall vulnerable to moisture accumulation
should water unintentionally enter the cavity. One recommendation
calls for removing the interior vapor barrier and relying
on two coats of latex paint on the interior to limit diffusion
from the conditioned space into the wall. This option allows
the wall to dry to some extent in both directions, but was
not chosen by the builder.
Ventilation
A heat recovery ventilator (HRV) mounted in the basement
provides controlled mechanical ventilation with an energy
penalty estimated at $45/year. The unit contains an 80-watt
fan that introduces 75 CFM of outside air while exhausting
a similar amount at a heat transfer efficiency of 70%. Attempting
to meet the new ASHRAE 62.2 standard (ASHRAE 1999) would
require 42 CFM of continuous ventilation. For these simulations
however, the old ASHRAE guideline of 0.35ACH was used, calling
for a continuous rate of 25CFM. The HRV can operate either
continuously or on an intermittent 20 minutes on, 40 minutes
off cycle. Intermittent operation was simulated to meet the
old guideline.
Cost Analysis
One row in Tables 35 and 36 shows the cumulative effect
of all measures added to the base case home. Estimated saving
in this row includes the cumulative effect of all measures
incorporated together in the DOE2 simulation. The heat recovery
ventilator (HRV) is broken out from the other measures to
provide a meaningful simple payback and first year cash flow
figures for the other cumulative measures. The HRV is considered
an essential component for the indoor air quality of these
homes, but comparing it to a base case home without ventilation
means no relative savings are attained; thus this measure
is added in a separate row. With the exception of the HRV
all measures show a positive cash flow on a 6%, 30 year fixed
rate mortgage beginning in the first year.
TABLE
35 Economic Assessment of Phase I Measures |
Energy
Measure |
Annual
Savings |
Installed
Cost |
Simple
Payback |
First
Year Cash Flow |
Reduce infiltration to
2.8 ACH50 |
$90 |
$325 |
3.6 |
$68 |
Upgrade to 92% direct
vent furnace |
$52 |
$600 |
11.5 |
$11 |
Switch to Programmable
Thermostat |
$23 |
$130 |
5.7 |
$11 |
Upgrade to Energy Star
appliances* |
$61 |
$730 |
12 |
$12 |
Change to EF=0.62 power
vented water heater |
$52 |
$520 |
10 |
$16 |
Increase from 10% to 85%
fluorescent lighting |
$31 |
$200 |
6.5 |
$17 |
All Measures |
$309 |
$2,505 |
8.1 |
$135 |
Heat recovery ventilation
@75cfm, 33% RTF |
-($45) |
$1,400 |
N/A |
($134) |
All Measures with
HRV |
$264 |
$3,905 |
14.8 |
$1 |
Notes:*
Energy Star appliances include refrigerator, dishwasher
and h-axis clothes washer |
- First
year cash flow based on 30 year fixed rate mortgage
with interest rate of 6%, down payment of 5%, and
discount rate of 5%. A general inflation rate of
3% per year was applied to the upgrade cost of measures
replaced at end of lifetime. Final value of equipment
is determined by linear depreciation over lifetime.
Interest paid on mortgage is considered tax deductible
using a tax rate of 28%. Energy costs escalate at
3% per year. A property tax rate of 0.8% was applied
to the energy upgrade cost and is inflated at 3%
per year. |
The
increased utility savings of Phase II over Phase I arise
from two energy saving measures unique for this area: Extruded
Polystyrene (XPS) foam sheathing with 2X4 framing and tankless
gas water heating. Simple paybacks for these measures were
8.3 and 13.3 years respectively. Electric water heaters
are the current norm in the Grand Forks area, but with
electricity 26% below the national average and natural
gas prices on the rise simple payback on the tankless model
was relatively long. In addition, fluctuating natural gas
prices complicate the economic analysis. Initial concerns
of how the tankless water heater would perform in this
extreme climate were met with positive feedback through
the first winter, which was colder than normal, including
an all-time record low of -44ºF
set at the Grand Forks International Airport on January 30,
2004.
TABLE
36 Economic Assessment of Phase II Measures |
Energy
Measure |
Annual
Savings |
Installed
Cost |
Simple
Payback |
First
Year Cash Flow |
Upgrade walls to (R10
sheath + R15 FG batt) |
$72 |
$600 |
8.3 |
$31 |
Reduce infiltration to
2.4 ACH50 |
$106 |
$325 |
3.1 |
$82 |
Upgrade to 92% direct
vent furnace |
$40 |
$600 |
15.0 |
-$1 |
Switch to Programmable
Thermostat |
$18 |
$130 |
7.2 |
$6 |
Upgrade to Energy Star
appliances* |
$60 |
$730 |
12.2 |
$12 |
Change to EF=0.83 tankless
gas water heater |
$94 |
$1,250 |
13.3 |
$10 |
Increase from 10% to 85%
fluorescent lighting |
$31 |
$200 |
6.5 |
$18 |
All Measures |
$421 |
$3,835 |
9.1 |
$158 |
Heat recovery ventilation
@75cfm, 33% RTF |
-($43) |
$1,400 |
N/A |
($134) |
All Measures with
HRV |
$378 |
$5,235 |
13.8 |
$24 |
Notes:*
Energy Star appliances include refrigerator, dishwasher
and h-axis clothes washer |
- First
year cash flow based on 30 year fixed rate mortgage
with interest rate of 6%, down payment of 5%, and
discount rate of 5%. A general inflation rate of
3% per year was applied to the upgrade cost of measures
replaced at end of lifetime. Final value of equipment
is determined by linear depreciation over lifetime.
Interest paid on mortgage is considered tax deductible
using a tax rate of 28%. Energy costs escalate at
3% per year. A property tax rate of 0.8% was applied
to the energy upgrade cost and is inflated at 3%
per year. |
Annual Energy Use
A performance comparison of the base case and improved structures
is shown in Table 37. The increased heating design load in
Phases I and II over the base case is caused by the addition
of 75 CFM of ventilation introduced on a 20 minutes ON, 40
minutes OFF cycle, which the base case does not have. The
DOE2 model predicts the need for very little cooling, however
many new homes in this area are being built with central
air conditioning.
TABLE
37 Simulated Performance Comparison of Base Case
and Improved Homes |
|
Base
Case |
|
Phase
I |
|
Phase
II |
|
HERS |
85.2 |
89.7 |
92.2 |
Total Annual Energy |
Cost |
Savings |
Cost |
Savings |
Cost |
Savings |
| |
$1,079 |
|
$815 |
25% |
$701 |
35% |
Annual
Cost |
Design
Load (kBtu/h) |
Annual
Cost |
Design
Load (kBtu/h) |
Annual
Cost |
Design
Load (kBtu/h) |
Heating |
$458 |
29.8 |
$366 |
33.4 |
$294 |
30.7 |
Cooling |
$15 |
9.9 |
$11 |
10.6 |
$10 |
10.3 |
Hot Water |
$245 |
|
$157 |
|
$116 |
|
H/C/WH Total |
$718 |
$534 |
$420 |
Four more dwellings (two duplexes) are slated for completion
in the summer of 2004. For more information on this project,
see Cold Climate Case Study: High Efficiency North Dakota
Twin Homes on www.baihp.org.
- Zero Energy Affordable Housing, ORNL and Loudon
County Habitat for Humanity
|
Figure
63 Local
sponsors in front of
2nd ZEH built by Loudon County
HFH in partnership with ORNL. FSEC provided monitoring
for the 1st and 4th ZEHs. |
In partnership with Oak Ridge, BAIHP prepared to instrument
a zero energy home (ZEH) built by Loudon County (TN) HFH
- their fourth (Figure 63). See description in the Technical
Assistance section of this report under Habitat
for Humanity, Tennessee, Loudon County.
Data is available on-line at www.infomonitors.com
. A paper on the study was submitted to the Buildings
IX conference by Jeff Christian (ORNL) and David Beal (BAIHP-FSEC).
|
Disclaimer:
This report was prepared as an account of work sponsored by an agency
of the United States government. Neither the United States government
nor any agency thereof, nor any of their employees, makes any warranty,
express or implied, or assumes any legal liability or responsibility
for the accuracy, completeness, or usefulness of any information,
apparatus, product, or process disclosed, or represents that its use
would not infringe privately owned rights. Reference herein to any
specific commercial product, process, or service by trade name, trademark,
manufacturer, or otherwise does not necessarily constitute or imply
its endorsement, recommendation, or favoring by the United States
government or any agency thereof. The views and opinions of authors
expressed herein do not necessarily state or reflect those of the
United States government or any agency thereof.
|


 You
are here:
You
are here: 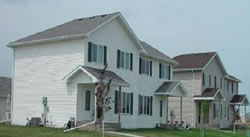
