| Publication
Index:
Duct
Tightness Data
Duct
tightness data presented have been gleaned from BAIHP Trip
Reports with some supplementary data from the preceding program,
the Energy Efficient Industrialized Housing Project.
Testing
Protocol
All
duct systems tested were in newly manufactured homes using
industry standard methods as delineated in the Minneapolis
Blower Door and Duct Blaster User Guides and augmented by
the Florida Home Energy Rating requirements where appropriate.
Factory
Visits and Test Results Summary
FSEC-BAIHP
data spans 1996-2003 and includes test results from 39 visits
to 24 factories of six HUD Code home manufacturers (Table
5). Researchers conducted tests on 101 houses representing
190 floors[3]. The data is a compilation of test results from
standard production duct systems, repaired to improved production
systems.
For
a description of improvements implemented at a single manufactured
housing plant, see Appendix A.
Average,
maximum, and minimum duct leakage data are presented in Table
6 and Figure 7 with similar data from a study published by
the Manufacture Housing Research Alliance for comparison (MHRA,
2003.) Figures 8-11 show all data points for Qntotal
and QnOut. for taped systems (Fig. 8 and 9) and
mastic sealed systems (Fig. 10 and 11).
For
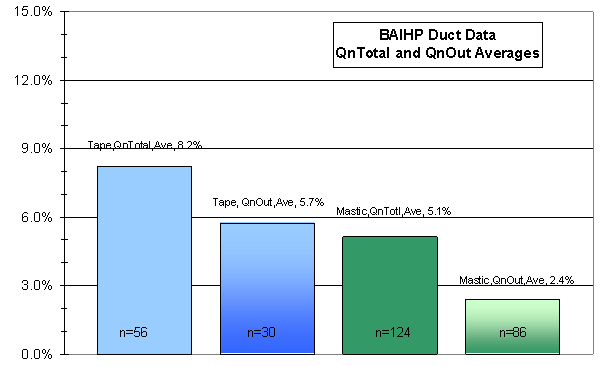
mastic sealed systems (n=132), average Qntotal=5.1%
(n=124) with 85 systems achieving the Qntotal
≤ 6% target (Fig. 10). Average QnOut=2.4%
(n=86) with 73 systems reaching the Qnout ≤
3% goal (Fig. 11).
For
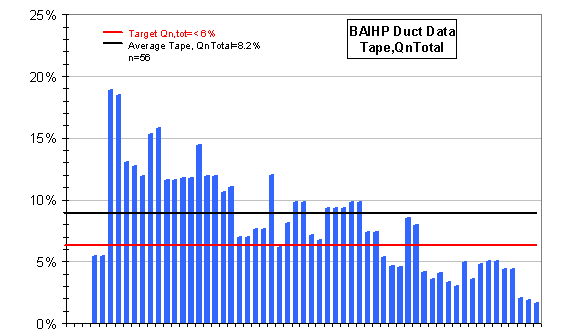
taped systems (n=58), average Qntotal=8.2% (n=56)
with 19 systems reaching the Qntotal ≤
6% target (Fig. 8). Average QnOut=5.7% (n=30),
more than double the mastic average, with 5 systems reaching
the Qnout ≤ 3% goal (Fig. 9).
The
average QnOut found in this data for mastic sealed
systems was 2.4%. This correlates with the Manufactured Housing
Research Alliance's study which found an estimated average
QnOut of 2.5% in 59 floors tested after duct repairs
at 16 factories (MHRA, 2003). MHRA did not report the total
leakage (measured) used to estimate leakage to the outside,
leakage for taped, or leakage for systems before repair.
| Table
6 Summary of Findings (see also, Figures 7-11) |
| |
BAIHP |
MHRA
|
|
Tape |
Mastic |
Mastic,
Repaired |
| Floors
Tested |
58 |
132 |
59 |
|
CFM25total
(cfm) |
71
avg (n=56)
210
max
13
min |
43
avg (n=124)
90
max
16
min |
NA |
|
CFM25Out
(cfm) |
49
avg (n=30)
186
max
13
min |
23
avg (n=86)
216
max
0
min |
NA |
| Qntotal |
8.2%
avg (n=56)
18.9%
max
1.7%
min |
5.1%
avg (n=124)
10.2%
max
1.6%
min |
NA |
| Qntotal
≤ 6% |
19 |
85 |
|
|
QnOut |
5.7%
avg (n=30)
17%
max
2.2%
min |
2.4%
avg (n=86)
18.9%
max
unmeasurable
min |
2.5%**
avg
(n=59) |
|
Qnout≤3% |
5 |
73 |
|
| Ratio
of QnOut to Qntotal |
56%
avg (n=30)
80%
max
20%
min |
36%
avg (n=80)
80%
max
0%
min |
50%
(apprx) avg (n=59)
60%
max
24%
min |
|
Source |
See
References, Data Sources |
(MHRA,
2003) |
| *Floor
refers to a single wide or one section of a multi-section
manufactured home.
**MHRA
estimated Qnout. see QnOut
compared to Qntotal,, p. 17 |


Figure 7. BAIHP Duct Data Averages
Top: Averaged CFM25Total and CFM25Out data show that mastic
sealed systems were tighter than taped systems in both total
leakage and leakage to the outside.
Bottom: Averaged Qntotal and Qnout data show that mastic sealed
systems, on average, met both the total leakage and leakage
to outside goals whereas the taped systems met neither.
 |
|
Figure 8. All Qntotal data points for
taped systems. Note that average (black line) is well
above target (red line). 19 tape sealed systems met the
6% Qntotal goal. |
 |
Figure 9. All QnOut data points for
Taped systems. Note that 5 taped systems met the 3%
Qnout goal. |


Mastic
Sealed Duct Systems
Of
the 190 floors tested, 132 had mastic sealed duct systems.
Researchers conducted 124 CFM25total tests and
86 CFM25Out tests.
Total
duct leakage only was measured in 44 mastic sealed systems.
Of those, 17 did not meet the Qntotal ≤
6% goal (Table 7). Problems centered on dimensional coordination
of duct components and misaligned pre-cut register holes in
sub-floor assemblies, incomplete mastic application, imprecise
cutting, and incomplete joints (eg tabs not bent).
|
Table
7 Mastic Sealed Systems Exceeding Target Leakage
Rates |
|
ID# |
Floors |
Qntotal |
Problems
Identified |
| 27 |
2 |
10.1% |
Holes
in main trunk oversized for floor boots, left unsealed. |
| 28 |
2 |
7.5% |
Leakage
at registers, furnace plenum, and joints. Many make-shift
tools, take-off material unknown |
| 51 |
1 |
8.0% |
Leakage
at registers, furnace plenum, and joints. |
| 25 |
2 |
8.3% |
No
mastic on furnace plenum |
| 13 |
1 |
|
No
mastic on furnace plenum |
| 45 |
1 |
6.7% |
Mastic
applied incorrectly |
| 26 |
2 |
7.3% |
No
mastic on furnace plenum |
| 29 |
2 |
6.8% |
Make-shift
tools; poorly fitted holes |
| 60,
14 |
2 |
6.4% |
Register
installed under interior wall (inaccessible for sealing).
Mastic applied incorrectly |
| 47
|
1 |
6.5% |
Tab-over
boots not making contact with trunk line. Gaps in mastic
application |
| 50 |
1 |
6.1% |
Leakage
found at registers, furnace plenum, and duct joints.
Mastic
applied inconsistently
Poor
boot connections |
Both
total and outside leakage tests were conducted on 80 mastic
sealed systems, of which 58 floors met both the Qntotal<=6%
and QnOut<=3% goals. The remaining 22 floors
were divided into three groups (Table 8):
- Floors
that met the QnOut but not Qntotal
(n=14). Qntotal range: 6.1% to 9.7%
- Floors
that met the Qntotal but not QnOut
goal (n=1) QnOut=4.1%
- Floors
that met neither goal (n=7).
Six
of the 7 floors that met neither goal were tested during two
initial factory visits. One of the factories did not pursue
BAIHP recommendations and the other is working toward achieving
the Qntotal ≤ 6%.
|
Table
8 Mastic Sealed Systems Exceeding Target Leakage
Rates |
|
ID# |
Floors |
Qntotal |
QnOut |
|
Floors
that met the QnOut but not Qntotal
(n=14). |
| 24 |
2 |
9.0%
(Fail) |
1.6%
(Pass) |
| 43 |
3 |
6.5%
(F) |
2.5%
(P) |
| 87 |
2 |
9.7%
(F) |
1.0%
(P) |
| 91 |
3 |
6.6%
(F) |
2.6%
(P) |
| 97 |
2 |
6.5%
(F) |
1.5%
(P) |
| 98 |
2 |
6.1%
(F) |
1.2%
(P) |
|
Floors
that met the Qntotal but not QnOut
goal (n=1) |
| 67B |
1 |
6.0%
(P) |
4.1%
(F) |
|
Floors
that met neither goal (n=7). |
| 100 |
2 |
8.9%
(F) |
3.4%
(F) |
| 39 |
2 |
9.7%
(F) |
3.4%
(F) |
| 54A |
1 |
9.1%
(F) |
3.3%
(F) |
| 99 |
2 |
6.3%
(F) |
3.1%
(F) |
Only
leakage to the outside was measured in 7 mastic sealed systems.
One floor had leakage too low to measure. All six remaining
floors failed to meet the Qnout goal (Table 9.)
|
Table
9 Mastic Sealed Systems Exceeding Target Leakage
Rates |
|
ID# |
Floors |
Qnout |
Problems
Identified |
| 124
125 |
1
1 |
18.9%
13.3% |
No
mastic on return or supply plenum. Holes cut with large
knife described by researchers as a "machete" Misalignment
of components throughout |
| 127
128
129
130 |
1
1
1
1 |
11.5%
9.8%
9.3%
7.2% |
Tested
in field shortly after set-up.
All
same manufacturer who is still in pursuit of Qnout
<=3% goal. |
QnOut
compared to Qntotal
The
MHRA study estimates QnOut(Table 6) using a measured
Qntotal multiplied by the ratio of QnOut
to Qntotal for a completed house from the same
factory.
For
example, if a completed house for Factory A was found to have
Qntotal=7% and QnOut=3.5%, then the
QnOut estimation factor for incomplete houses at
Factory A would be 0.5 (7%/3.5%). The value of QnOut
to Qntotal ratios found by MHRA ranged from 24%-60%
(MHRA, 2003).
Field
measurements in new site built homes (Cummings, et al, 2002.)
and many of MHRA's field measurements in new manufactured
homes show QnOut is often approximately half of
Qntotal, and in the absence of field data, MHRA
used 50% as the multiplier to estimate QnOut from
the measured Qntotal (MHRA, 2003.) As mentioned
earlier, the goal of Qntotal<= 6% originates
from applying the 50% rule of thumb multiplier to obtain a
QnOut<=3% goal, which is the BAIHP recommended
duct leakage level corresponding to the most stringent duct
leakage level in the Manufactured Home Energy Star program.
BAIHP
data includes 26 taped systems that researchers tested for
both total and outside leakage. The average ratio of outside
to total leakage was 56%, roughly agreeing with the rule of
thumb. However, in the 80 mastic sealed systems, the average
ratio of outside leakage to total leakage was somewhat lower
than expected at 36%. There were 13 mastic sealed systems
that met the Qnout ≤ 3% goal without
meeting the Qntotal ≤ 6% goal.
This
lower than expected ratio is perhaps due to the improved sealing
at joints between duct components but not between the house
envelope (e.g. subfloor or ceiling) and the air distribution
system (e.g. supply boots and return plenums). Leakage where
the supply boot joins to the house is part of the total leakage,
but tends to be associated with leakage to the interior of
the house.
Though
the average ratio of outside to total leakage in the mastic
sealed systems was slightly lower than expected (36%), the
range spanned 0% (leakage to outside too small to register)
to 80%. The data strongly supports that achieving a Qntotal
of 6% signifies that the QnOut will be less than
3%. One exception was documented (QnOut=4.1%),
proving that using Qntotal as a surrogate test
for the QnOut goal is not a guarantee.
Quality
Control: Tangible Success
An
objective quality control strategy is essential to achieving
tight duct construction. If air were visible to the naked
eye, a visual inspection would reveal leakage sites in any
given duct system. In the absence of visible air, managers
and line workers will need to learn a way to evaluate their
duct construction quantitatively using pressure testing equipment
common to building science.
Initially,
a standardized duct test on the factory floor provides an
objective evaluation of current practice, repairs, and process
improvements. Ultimately, pressure testing all duct systems
replaces subjective evaluation with a tangible, objective
measure of success: total duct leakage, CFM25total
or a ratio of duct leakage to conditioned area, Qntotal.
These surrogate measurements are shown by this data and other
field studies (Cummings, et al, 2002. MHRA, 2002) to substantially
correlate with duct leakage to the outside of completed houses,
the factory's ultimate quality goal.
The
support of BAIHP as objective, third party experts is often
cited by manufacturers as a major benefit. Some manufacturers
have already adopted the test procedure into their production
process to conduct their own in-house verification of duct
system tightness. This leads to a higher quality product as
well as accountability of both the factory and field work
force.
Continue
to Economics of Duct Tightening in Manufactured Housing >> |


